Bitcoin's 'Mayer Multiple' Metric
Understanding the “Buy the Fear” Signal

Bitcoin’s Mayer Multiple is a key metric used to assess whether Bitcoin (BTC) is fairly priced relative to its historical trends. Specifically, it compares the current Bitcoin price to its 200-day Simple Moving Average (SMA 200D). When the Mayer Multiple falls below 1, it signals that Bitcoin is trading at or below its long-term average price, a situation many traders interpret as a “buy the fear” opportunity.
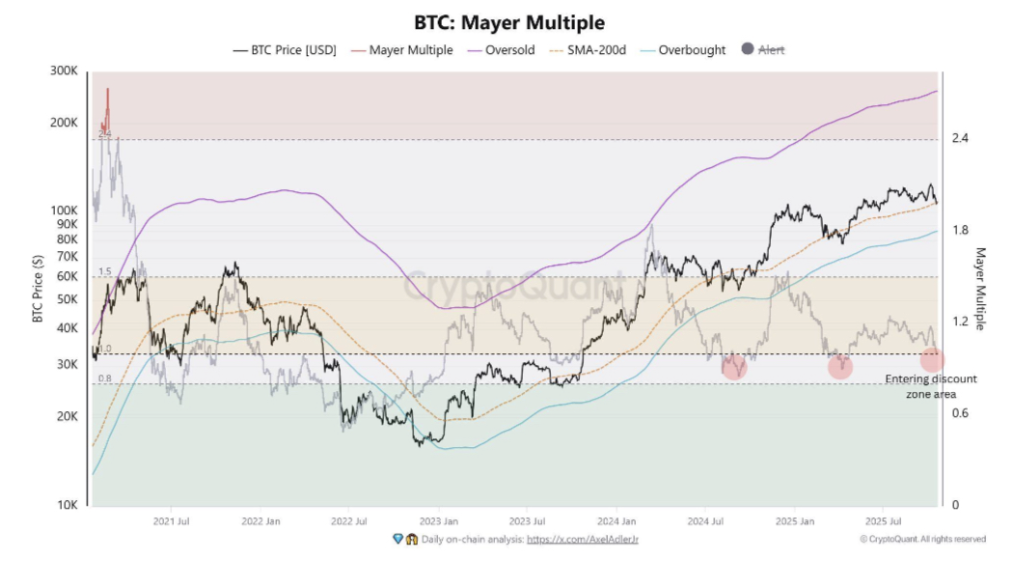
As of late October 2025, the Mayer Multiple has moved below 1, marking only the second occurrence in 2025 and the third since the last Bitcoin halving and the start of the Trump administration. The previous instance in April 2025 coincided with macro uncertainty driven by Trump-era tariffs, a situation somewhat similar to current market conditions. This area below 1 is generally considered a discount zone, where market participants perceive Bitcoin as undervalued relative to its historical trend.
From a technical perspective, the SMA 200D serves as a long-term benchmark. When prices approach or dip below this line, smart money investors often accumulate. This accumulation reflects confidence that Bitcoin will eventually regain momentum and reach previous high ranges. The Mayer Multiple therefore provides both a quantitative signal and a psychological cue for investors seeking buying opportunities.
Examining Bitcoin’s price action, BTC recently retreated to approximately $103,000 due to macro concerns, particularly regarding tariffs with China. The market has since recovered to a resistance range of $110,000–$111,000, where the 13-day Exponential Moving Average (EMA) now acts as a short-term barrier. The 13 EMA is important because it often represents the immediate trend and can indicate whether Bitcoin will maintain momentum or face short-term rejection.
Scenario analysis is crucial for traders interpreting these levels. If BTC is held by resistance at $110,000–$111,000, a potential downward movement could occur, targeting support levels near $104,000 or $102,000. Conversely, if the resistance is broken decisively, BTC could retest previous high ranges between $120,000 and $124,000. In both cases, observing volume, accumulation addresses, and broader macro sentiment provides further confirmation of market trends.
The Mayer Multiple also complements fundamental observations. Bitcoin accumulation addresses have recently shown increased activity, indicating that long-term holders are taking advantage of current price levels. This accumulation strengthens the argument for a future price recovery, providing a rational basis for optimism even amid short-term fluctuations.
For less technical observers, the key insight is that metrics like the Mayer Multiple combine historical price trends with market psychology, highlighting zones where assets may be undervalued. It is not a guarantee of immediate gains, but it provides a scientifically grounded framework for understanding market behavior.
In summary, Bitcoin’s Mayer Multiple dropping below 1 signals an area of potential opportunity, reinforced by SMA 200D support and observed accumulation patterns. Combined with macro conditions and short-term resistance at the 13 EMA, this suggests that Bitcoin is currently in a strategically important zone. Traders and investors can view this as a signal to monitor accumulation and potential breakout points carefully. While short-term volatility may persist, the Mayer Multiple and supporting fundamentals indicate that Bitcoin could reclaim high ranges once momentum is reestablished, making it a critical period for both technical and fundamental analysis.